
Help Center Profit & reports
Reports
Revenue, profit, and margin for any date range, broken down by source, platform, category, and bin.
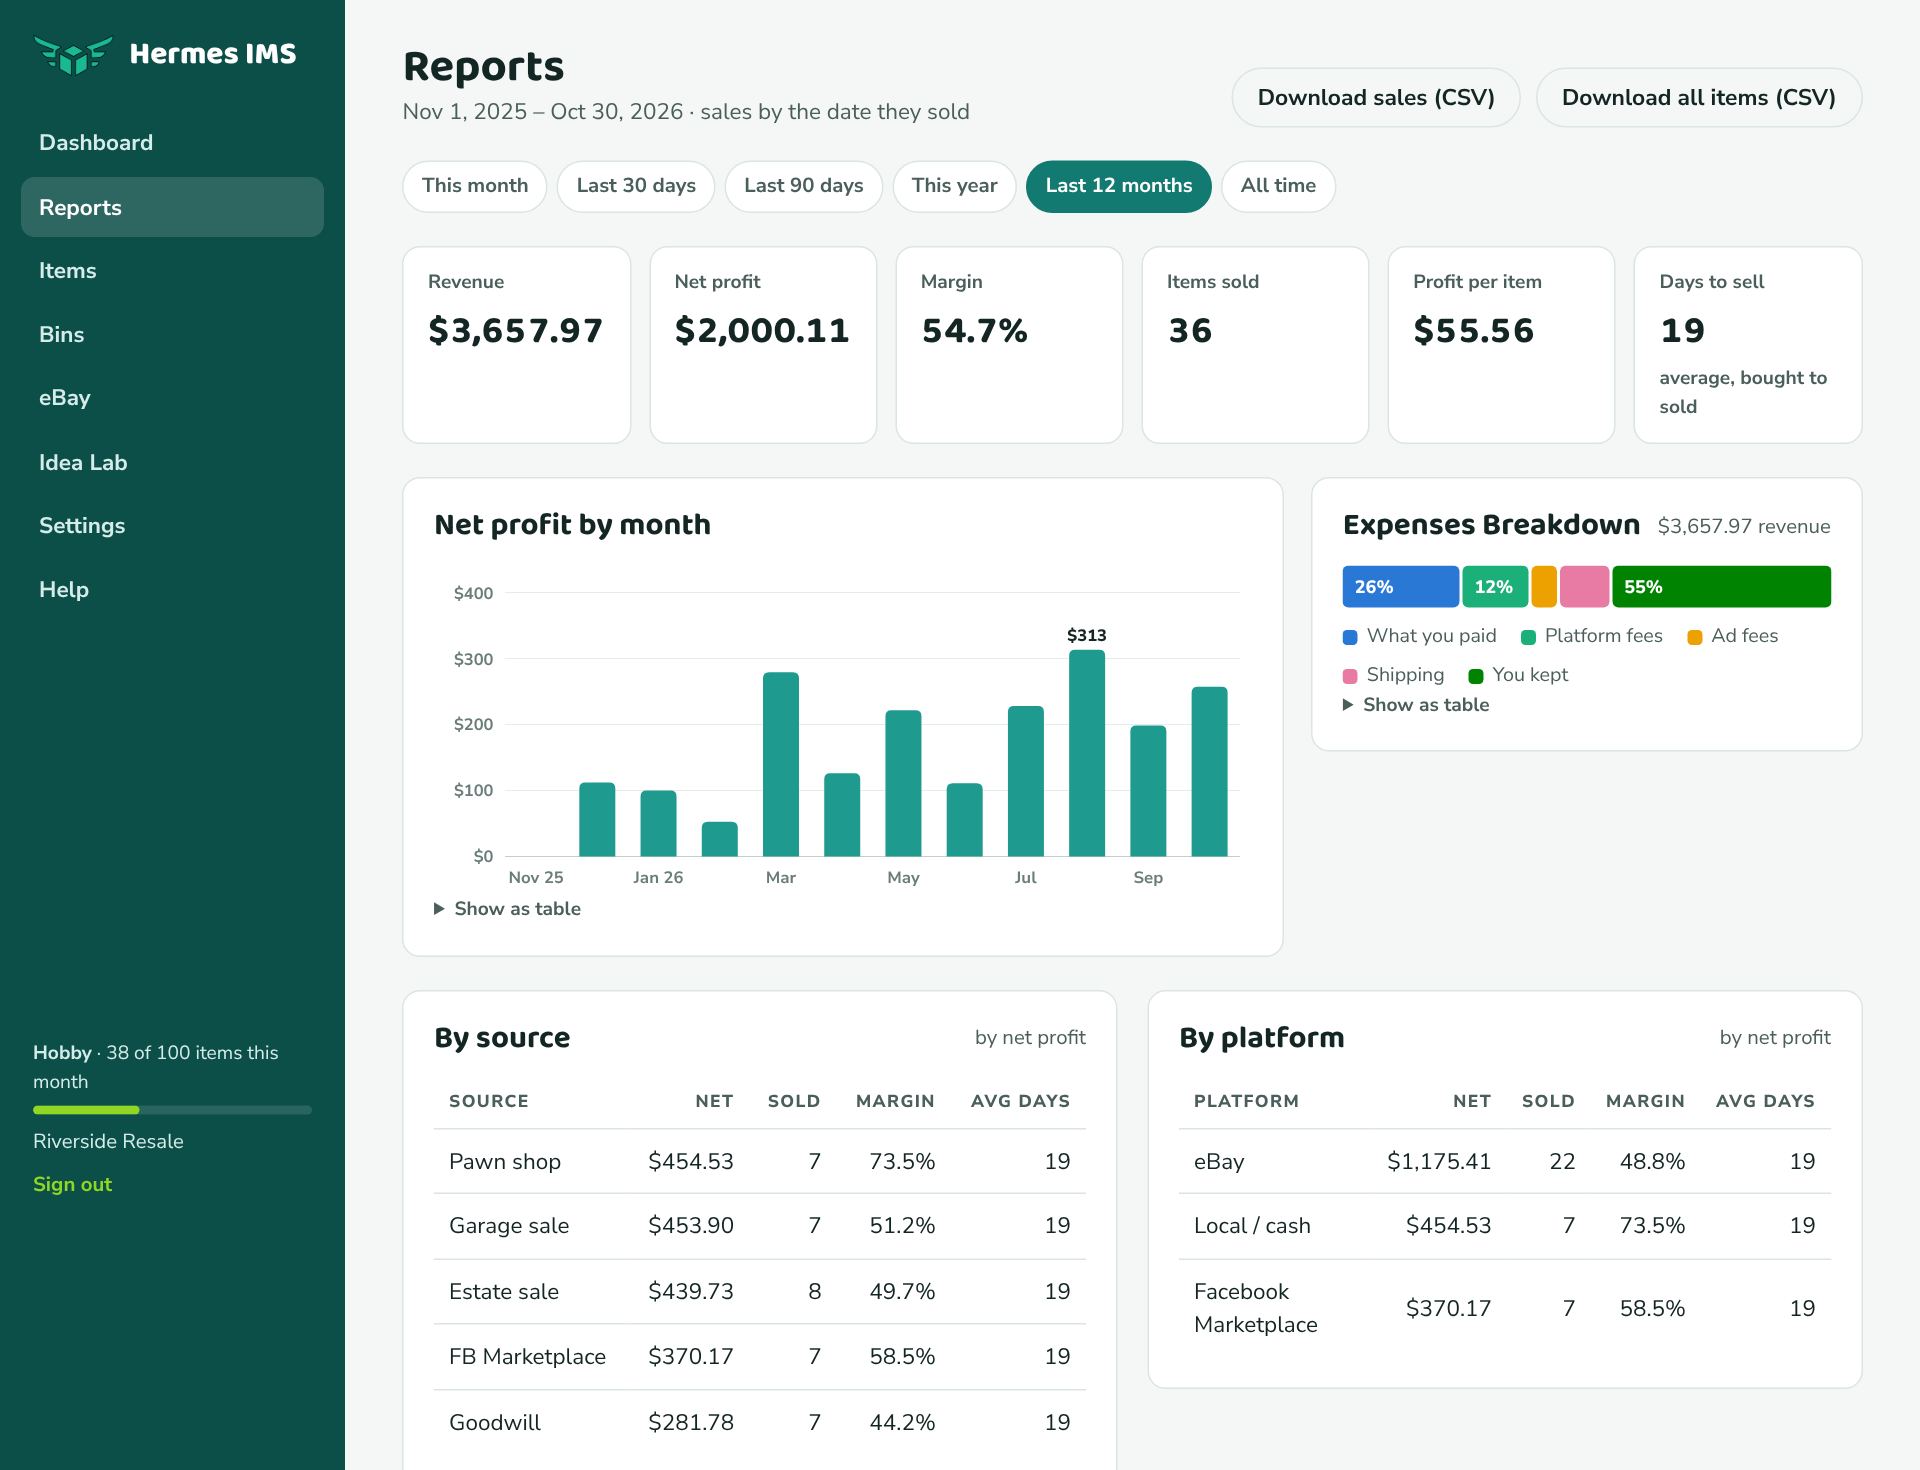
Pick a date range
Use the tabs: This month, Last 30 days, Last 90 days, This year, Last 12 months, or All time. Sales count in the range by the date they sold, in your time zone.
The totals
| Total | Meaning |
|---|---|
| Revenue | What buyers paid: sale prices plus shipping they paid, minus refunds. |
| Net profit | What you kept after every cost. See How profit is calculated. |
| Margin | Net profit as a share of revenue. |
| Items sold | Sales in the range. |
| Profit per item | Average net profit per sale. |
| Days to sell | Average days from buying (or listing, or adding) to selling. |
Net profit over time
A bar for each day, week, or month (Hermes picks the size that fits the range). Hover or tab to a bar for details, or click Show as table.
Expenses Breakdown
Splits revenue into what you paid for items, repairs, platform fees, ad fees, shipping, and what you kept. If you made a loss in the range, it shows costs only.
Breakdowns
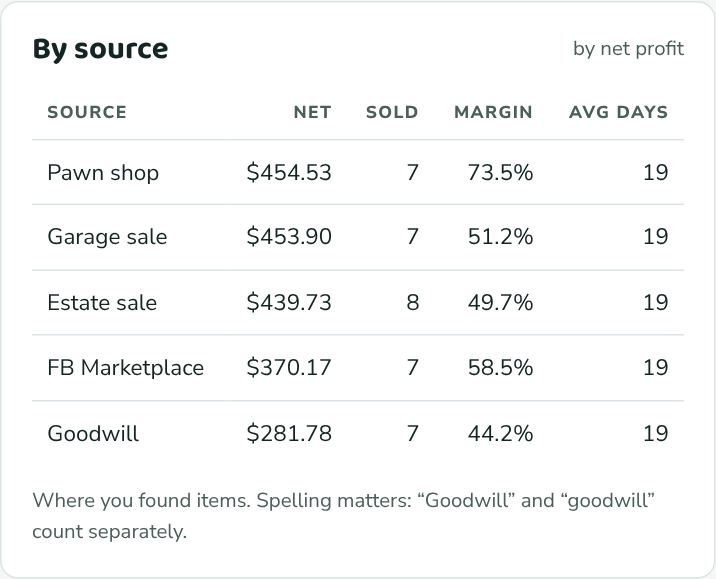
By source, By platform, By category, and By bin list your top 12 in each, sorted by net profit, with items sold, margin, and average days to sell.
Best and worst sales
Most profitable lists your top 5 sales in the range, and Losses lists the ones that lost money, so you can see what to buy more (and less) of.