
Help Center Getting started
Tour the dashboard
Every number and chart on the dashboard, and what to do with it.
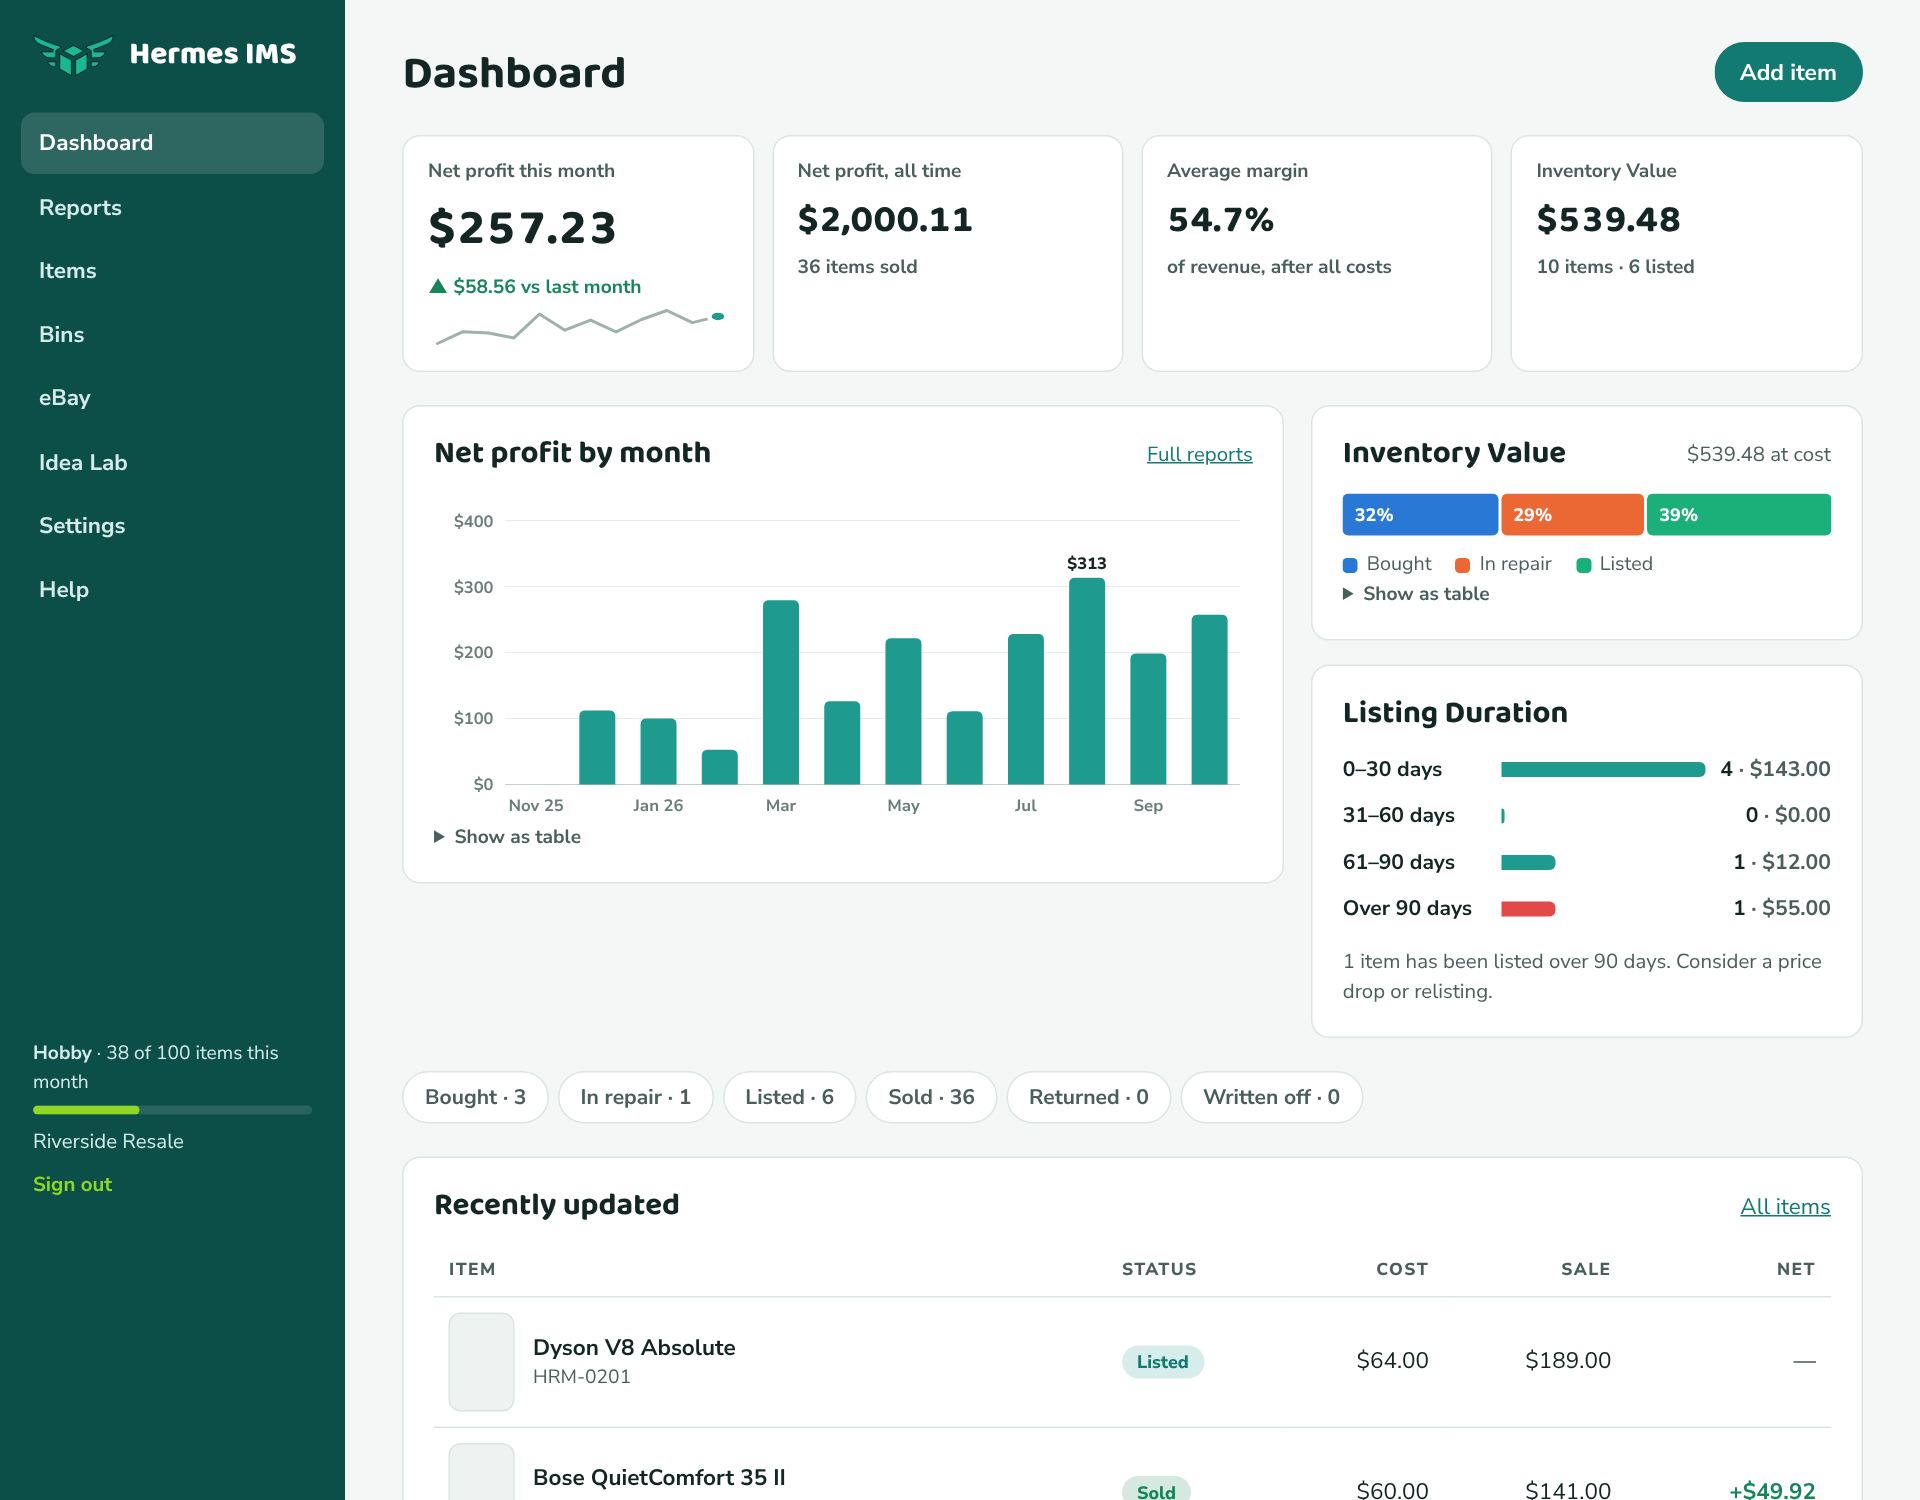
The four tiles at the top
| Tile | What it shows |
|---|---|
| Net profit this month | Profit from items sold this calendar month, with the change versus last month and a 12-month trend line. |
| Net profit, all time | Total profit from everything you've sold, and how many items that is. |
| Average margin | Net profit as a share of revenue, across all sales. 40% means you keep $40 of every $100 a buyer pays. |
| Inventory Value | What you've spent (price paid plus parts) on items that are Bought, In repair, or Listed. |
Net profit by month
One bar per month for the last 12 months. Months with a loss show below the line in red. Hover over (or tab to) a bar to see that month's revenue and number of sales. Click Show as table for the exact numbers, or Full reports for any date range.
Inventory Value
Splits your inventory value by status, so you can see whether it's sitting in things you haven't listed yet, things being repaired, or live listings.
Listing Duration
Groups your Listed items by how long they've been up: 0–30, 31–60, 61–90, and over 90 days, with the count and money in each. Over 90 days is shown in red.
Status counts and recently updated
The row of buttons (Bought · 3, Listed · 6, …) jumps to the items list filtered by that status. Below it are the items you changed most recently.
The sidebar
At the bottom of the sidebar is your plan and how many new items you've added this month out of your limit. Click it to open Plan & billing. On a phone, the sidebar is the menu button (☰) at the top right, and your monthly count is in Settings → Plan & billing.